Inquiry
Inquiry cart car is empty.
Today’s advanced, PC-based digitizers for high-speed data acquisition are necessary for myriad applications – ranging from signal analysis, lidar, ultrasound imaging and non-destructive testing, to communications, particle physics, mass spectroscopy and more. This article describes the unique performance parameters engineers should use when selecting a high-speed digitizer.
Today’s highest-performance high-speed digitizers are installed on a shared electrical bus, such as a PXI or VXI bus within a dedicated instrument chassis or a PCI Express (PCIe) bus within most modern PCs. Modular digitizers may be integrated with other modular instruments under the control of a custom software application to create custom automated test equipment. A 4-channel, 16-bit, 1000 MS/s digitizer card is shown in Figure 1. On the bottom of the card is the PCIe edge connector used to install it in a PCIe slot within the host PC. Once installed, the card’s SMA signal connectors emerge from the back of the PC chassis
Digitizer companies generally advertise three key specifications: channel count, vertical resolution and maximum sampling rate to indicate performance.
The channel count is simply the number of separate electrical signals that a digitizer can acquire. Generally, a digitizer is equipped with only a single acquisition sequencer, so that signals from all channels, while different, are all acquired in an identical fashion – namely, using the same sampling rate and trigger.
Vertical resolution, specified in bits, reveals the number of discrete digital levels into which the vertical input voltage range of a digitizer is divided. This number of levels is equal to 2B, where B is the number of bits of resolution. For example, an 8-bit digitizer divides the vertical input range into 28 = 256 discrete levels. By contrast, a 16-bit digitizer divides the vertical input range into 65536 levels, which proportionately increases the sensitivity to signal features by a factor of 256.
Figure 2 shows how bit depth impacts signal clarity The value of high resolution is evident in applications where there are signals with high dynamic range—that is signals combing both high and low amplitude components such as those mentioned in the introduction.
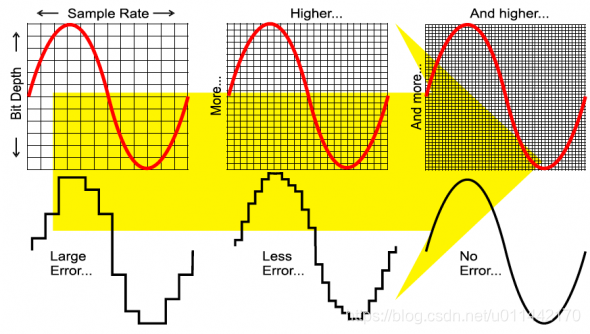
Fig.2. Figurative illustration of the relative accuracy of a 4-bit, an 8-bit digitizer ((typical of DSOs) and the 16-bit depth characteristic of the higher-end digitizers.
More than vertical performance In the process of converting an analog signal into a digital one, distortion can occur. A pure sine wave, together with a sine wave that has been compromised by the addition of broadband signal noise and by signal distortion - can manifest as attenuation near the input range limits, which is the typical precursor to signal clipping. Consequently, the true measure of the vertical performance of a digitizer is not its nominal vertical resolution but the ENOB (Effective Number of Bits). ENOB is the effective resolution that is achievable in practice accounting for signal distortion and random noise introduced by the digitizer. The 16-bit RazorMax PCI Express (PCIe) digitizer in the example (Figure 1) exhibits the industry’s best ENOB of up to 12.1 bits.
There is an important distinction between the absolute and relative accuracy of digitizers. The absolute accuracy of a digitizer describes how close its measured voltage values correspond to true absolute voltage reference standards. By contrast, relative accuracy specifies the fidelity of the shape of the acquired waveform with no reference to absolute reference standards. Using onboard calibration techniques, a high-speed digitizer may achieve absolute accuracies of an order of 0.1% of the full-scale input voltage range. In most digitizer applications, however, users are principally concerned with relative accuracy, which is specified by the Dynamic Parameters. The fidelity of a signal acquired by a digitizer device may be compromised by three distinct factors: Addition of random noise by the digitizer to the acquired signal. Distortion of the acquired signal by the digitizer. Irregularities in uniformity of the time intervals between samples acquired by the digitizer arising from imperfections in the ADC clocking signal.
The sampling rate, usually measured in Mega Samples per second (MS/s), refers to the number of samples acquired by a digitizer per unit time. Nyquist sampling criterion requires the sampling rate to be at least twice the maximum frequency that a signal contains.
While the sampling rate is a key digitizer specification, an often-overlooked element of its time-domain performance is its frequency response curve. This curve is measured by acquiring a fixed amplitude sine wave with a digitizer and determining apparent measured sine wave amplitudes over a broad frequency range. The frequency response curve for the RazorMax PCIe digitizer is shown in Figure 3. Frequency response curves function to show the analog input bandwidth, which is the frequency beyond which the digitizer attenuates a sine wave signal by 3dB or more. The bandwidth can be viewed as the -3dB roll-off frequency of the low-pass filter that a digitizer effectively presents to an input signal. A common digitizer rule-of-thumb requirement is that the maximum frequency component within a signal acquired by a digitizer must be less than the digitizer’s bandwidth. It is worth noting that the Nyquist sampling criterion employs and suffers from a similar simplification as the digitizer bandwidth rule-of-thumb. The Nyquist criterion requires 2X oversampling of the maximum signal frequency (or signal bandwidth) under the assumption that a signal has a brick wall spectrum, with no frequency components above the signal bandwidth frequency. A real signal will roll off more gently than a brick wall, so determining the required sampling rate becomes more nuanced. Often 5X or 10X over-sampling factors are employed to ensure that high-frequency signal components beyond the signal bandwidth are accurately acquired. In the example of Figure 3, although a 200MHz signal is well below the 300MHz bandwidth of the digitizer, there is still an attenuation factor of -1dB, which corresponds to an amplitude decrease of about 11%. This significant attenuation may or may not be acceptable to the user, depending upon the application.
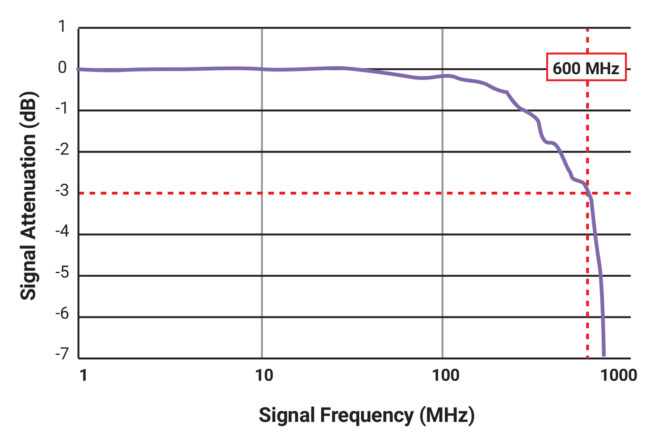
Fig. 3. Frequency response curve of the Gage digitizer shown in Fig. 1. The vertical red line indicates the 600 MHz analog input bandwidth (or -3dB roll-off frequency) of the digitizer.
To maximize flatness in the pass band of the frequency response, engineers might maximize digitizer bandwidth so that higher signal frequencies could be acquired without attenuation. However, a digitizer’s bandwidth and ENOB are antipathetic –as one improves, the other degrades. Higher bandwidth reduces the low-pass filtering effect upon a signal. This lets through more high-frequency noise, which in turn degrades the ENOB. Consequently, digitizer engineers must determine the optimal operating point that provides both sufficient ENOB performance and sufficient bandwidth. In addition to knowledge of its ENOB, consideration of its frequency response curve is paramount to the optimal selection of a digitizer for a given application.
BY ANDREW DAWSON, VITREK LLC. Andrew Dawson is engineering manager and application specialist at Vitrek, LLC, providers of global solutions for high voltage test and measurement. https://vitrek.com