Inquiry
Inquiry cart car is empty.
When measuring current in the field of power analysis greater than 30 A, highly accurate current transducers are required that can convert the primary current into a measurable secondary signal for the power analyzer (PA).
The current transducers should be able to precisely transform the amplitudes to the secondary side. Even small ratio errors can lead to major deviations when determining efficiencies and losses. This is because losses cannot be measured directly and can only be calculated as the difference between the input power and the output power.
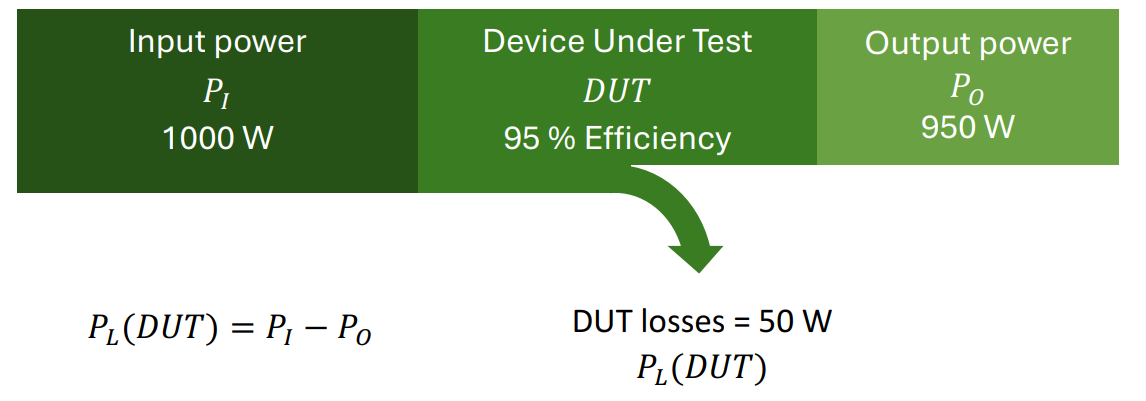
With the power values used in the figure 1, an example calculation for current transducers with the ratio accuracy of 0.1% can now be performed. In the worst-case scenario, the measured value of the input power is increased by 0.1% and at the same time the measured value of the output power is decreased by 0.1%. This results in the largest possible error for the calculation of the power loss.
Pi+0.001×Pi=1001 W
Po−0.001×Po=949.05 W
The power loss of the DUT, PL(DUT), is given directly as: PL(DUT)=51.95 W
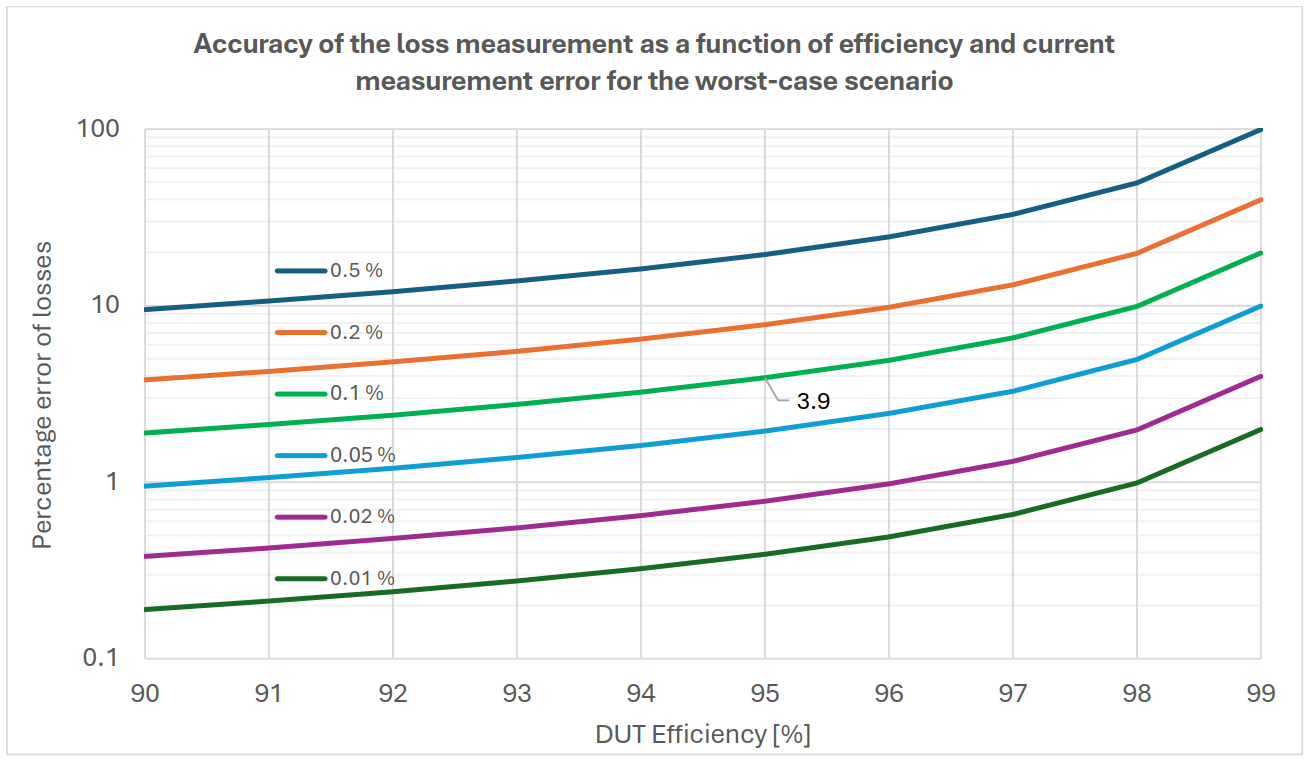
Percentage Error of the Power Loss is 51.95W / 50W×100=0.039×100=3.9%
If current transducers with an accuracy of 0.1% are used to measure the input and output power, the calculated power loss of the test device, such as a frequency converter, can deviate from the true value by 3.9% in the worst case.
The following diagram (figure 3) shows the effects of various ratio errors in current measurement on the percentage deviations in the loss calculation. The measurement errors of the power analyzer or the voltage sensors must also be taken into account in practice. The calculated value of 3.9% is marked on the green line for the accuracy of 0.1%. The percentage error in the loss calculation increases as the efficiency of the device under test increases.
To keep the error as low as possible, even for high-efficiency frequency converters or motors, Danisense highaccuracy fluxgate current transducers are a perfect choice. The accuracies for the ratio error are in the ppm range.
1 percent = 1% = 1 × 10⁻²
1 parts per million = 1ppm = 1 × 10⁻⁶
In addition to a very small DC offset, which can be compensated by most measuring devices, the ratio error is split into two values in the data sheet. The first value is the percentage error of the measured value. The second value is a fixed value over the entire current measurement range, which is given as a percentage of the full-scale value. As an example, the following table can be found in the latest data sheet of the DN1000ID1.
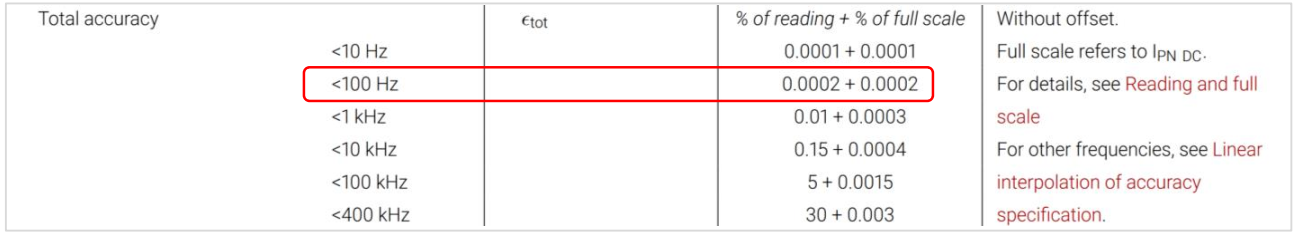
With this information, the complete measuring error ∈tot can be calculated as a function of the primary current. The DC rated current IPN DC is 1000 A according to the data sheet.
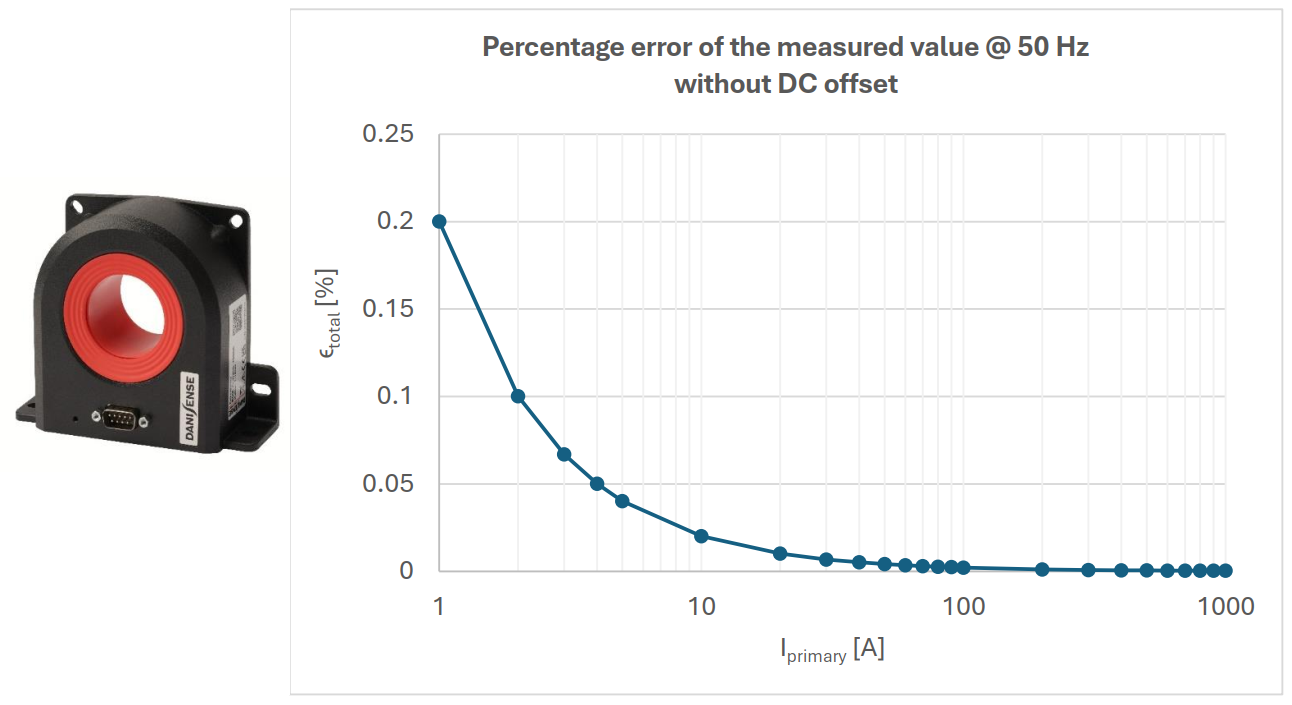
For the DN1000ID at 50 Hz, this results in the following diagram in figure 5 for the total ratio error.
In the lower excitation level, the percentage errors are higher due to the inversely proportional function of the total error. Already from 100 A primary current onwards the error values are optimal for the power analysis.
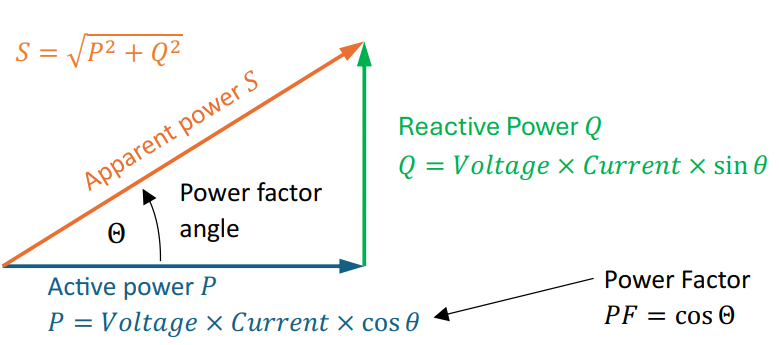
The phase error of the current transducers that are used also results in an additional error in the power measurement. The basis here is the generally known power triangle and the power factor defined via the power triangle.
Power factor is described as leading if the current waveform is advanced in phase with respect to voltage or lagging when the current waveform is behind the voltage waveform. A lagging power factor signifies that the load is inductive, as the load will consume reactive power.
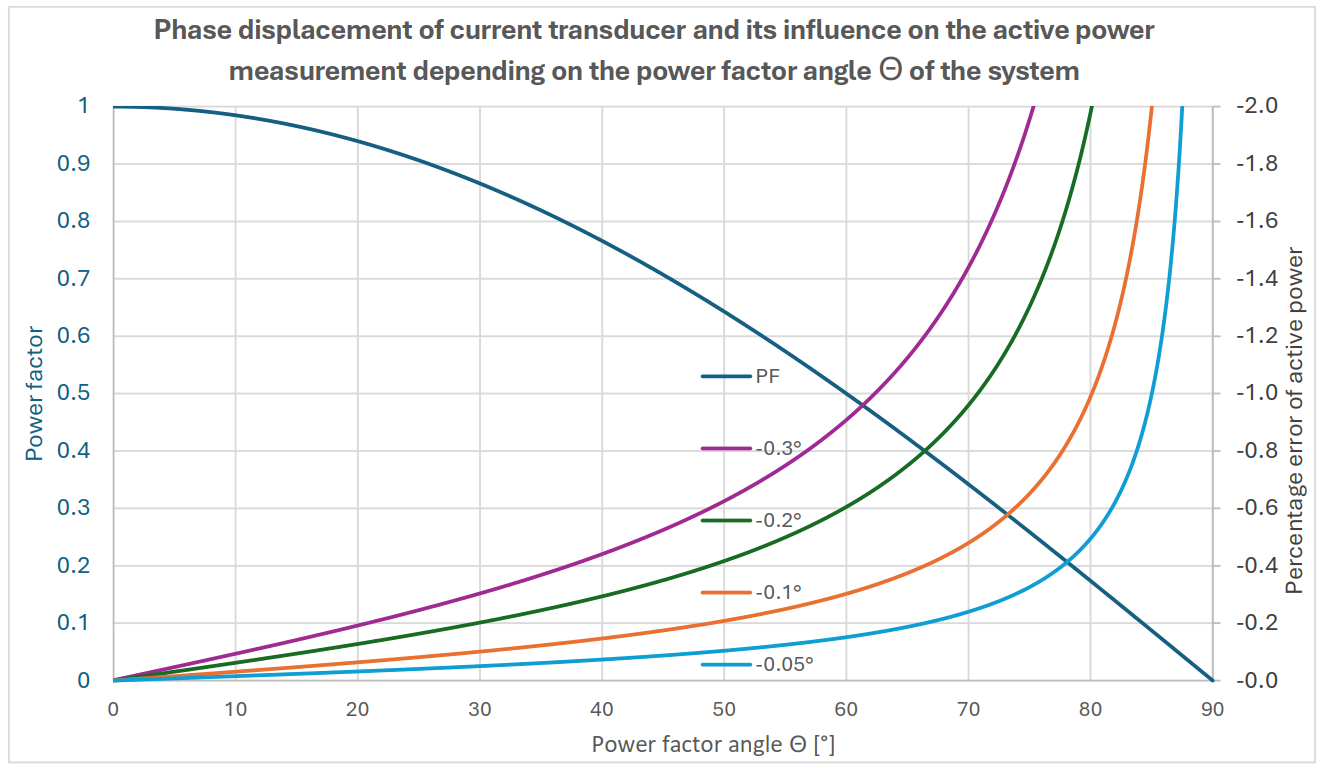
A phase error of the current sensor changes the phase angle Θ between the current and voltage signal. The effect on the percentage error in the active power measurement depends strongly on the power factor of the system, since the trigonometric functions are non-linear.
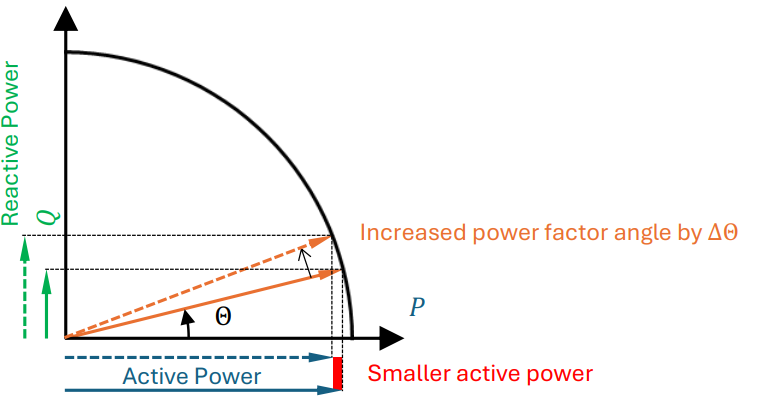
If the device under test consumes active and reactive power, an increase of the phase shift angle by the current transformer or the measuring system causes an increase of the reactive power with a simultaneous decrease of the active power. This relationship is shown in the following figure.
To calculate the impact on the active power, the percentage reduction of the power factor can be calculated as follows.
Percentage reduction in acvtive power = cos(Θ+ΔΘ)-cos(Θ) / cos (Θ) × 100
In the IEC 61869-1, the phase displacement of current and voltage transformers is named Δφ. At the same time, a positive phase error means that the secondary current leads the primary current. Point 3.4.4 states:
"The phase displacement is said to be positive when the secondary voltage or current phasors leads the primary voltage or current phasors. It is usually expressed in minutes or centiradians."
This means that for the ohmic-inductive load shown above, a secondary signal of the current transducer lagging the primary current leads to a larger power factor angle Θ. The phase displacement Δφ of the current transducer is negative in this case. Furthermore, the influence of the phase displacement becomes significantly larger with an increasing reactive power component, as the following diagram shows.
The calculation is based on sinusoidal waveforms. For current and voltage signals generated by pulse width modulation, the influences can be even greater. In any case it can be said that the entire measuring system and thus also the current transducers used should have the smallest possible phase displacement.
Some manufacturers of power analyzers offer compensation options of phase displacements caused by the measuring sensors. To use this function, precise data about the current transducer should be available from the manufacturer. A specification of the phase error in angular minutes at nominal frequency is often not sufficient, as the following explanations will show.
Assume a 50 Hz signal which represents a complete sinusoidal oscillation within 20 ms. If no time offset is given by the current transducer, we get an undelayed secondary signal, which is shown in blue in the following diagram.
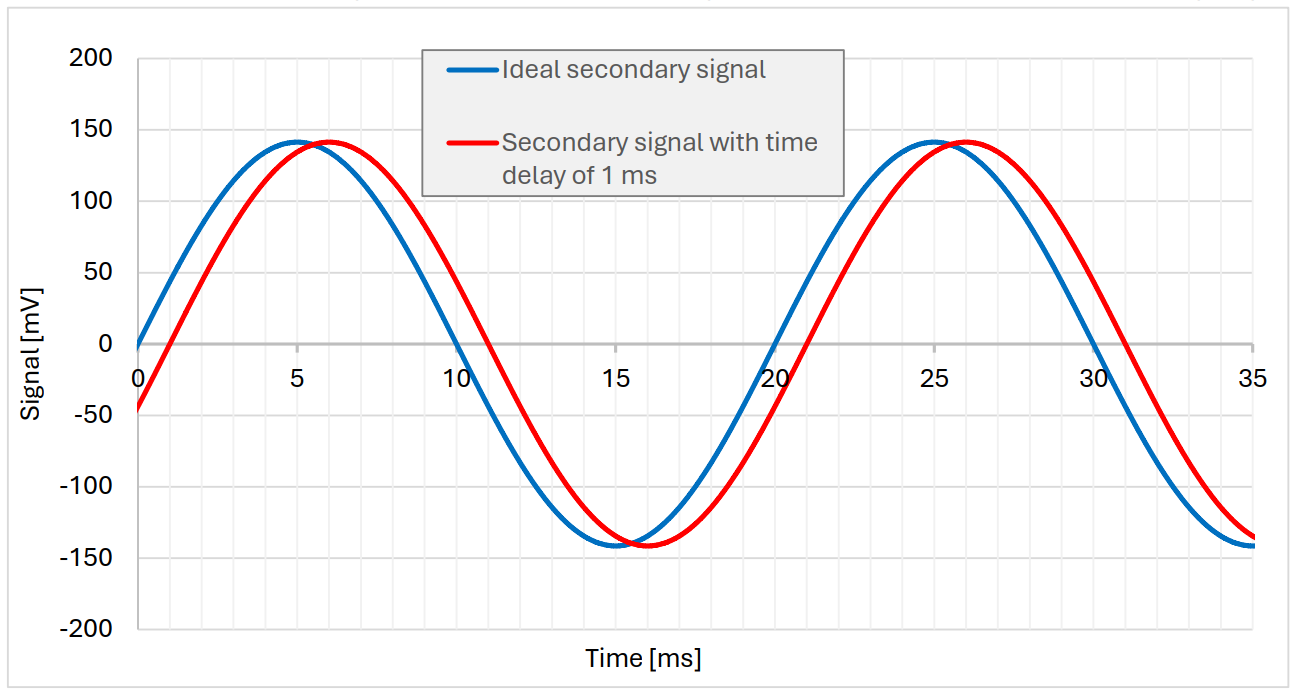
If the current transducer now generates a time delay of one millisecond, the secondary signal shifts to the right by one millisecond. In this case, the red time-delayed secondary signal lags behind the ideal signal.
The time period of the signal T can be calculated via the reciprocal of the frequency f.
T =1 / f ⇒ T=1/50 ⁄s = 20 ms
The time delay Δt is 1 ms and one period corresponds to the full angle of 360°. Thus, the phase shift angle Δφ can be calculated as follows.
Δφ / 360° =Δt / T ⇔ Δφ =Δt/T × 360° ⇒ Δφ =1 ms / 20 ms × 360° = 18°
The phase shift angle is 18° at one millisecond. The phase error is shown as a negative value when the secondary signal is lagging behind the primary signal. If the secondary signal is leading the primary signal, the phase error is positive. The correct data sheet specification in this case would be Δφ = -18° for a traditional inductive current transformer which is specified for the 50 Hz network.
It is obvious from the mathematical equations that a higher-frequency signal with a constant time delay on the secondary side of the current transformer causes a larger phase shift angle. For example, if the higher-frequency signal oscillates at 500 Hz, the corresponding time period is reduced to 2 ms.
T =1 / 500 ⁄s = 2 ms
For the 500 Hz signal, this would result in a phase shift angle of 180° at a time delay of 1 ms.
Δφ =1 ms / 2 ms × 360° = 180°
If the current transducer has a constant time shift over all measurable frequency components of the signal, there is a linear relationship between the phase shift angle and the frequency of the signal. For a secondary signal that lags the primary signal, the following formula applies accordingly.
Δφ(f) = (-1) × Δt × 360° × f
The development department of the Danish manufacturer of precision current transducers Danisense was able to minimize all parasitic influencing factors such as magnetization losses and stray fields of the secondary windings in the latest top model DW500UB-2V in such a way that the current transducer only has a very small and constant signal time delay, which is mainly caused by the secondary output BNC cable. The time delay is about 12.5 ns with a 2 m cable and varies slightly from device to device. With this specific value, the respective phase shift can be calculated relatively easily for each frequency using the above formula. Graphically, the linear relationship between phase shift and frequency becomes more obvious

For each delivered device, this specific time delay is documented by Danisense in the corresponding electronic test report, which can be accessed directly on the device via a QR code. This time delay can now be entered in the input mask of the power analyzer, so that the phase error of the current transducer is compensated almost perfectly.
The real measurement results of the DW500UB-2V up to 10 MHz which are shown in the following diagram are almost ideal due to the compensation of the time delay of 12.5 ns up to 10 MHz.

Especially when using frequency converters with a high switching frequency to control motors, active components of the power can also be found in the three-digit kHz range, since multiples of the switching frequency show up in the current and voltage signal according to the following equation.
f = n × fc ± 2 × n × f1
f=frequency of detectabble amplitudes
n=multiplier(1;2;3;...)
fc=switching frequency of PWM
f1=fundamental frequency
What currents can finally be expected in a motor will be discussed in the following. Real parameters of a 2.2 kW
motor are used for this purpose, and they are listed in the following figure.

At higher frequencies, the reactance of the motor increases. This reduces the power factor and higher-frequency current components are damped.
X1 = ω x L = 2πf × L These relationships are shown in the diagram below.

Due to the inductance of the motor, the current signal is smoothed so that the curve shape is clearly more sinusoidal than the voltage signal. Despite the unfavorable impedance ratios, higher frequency signals also generate active components which should also be measured accurately. In the following figure, operated at no load. The inverter switching frequency is at approx. 6 kHz. Integer multiples of the switching frequency are shown up to approx. 150 kHz. The following amplitudes are caused by cable reflections and have their maximum at approx. 340 kHz. ( ZES Zimmer Applikationsbericht 109 - https://www.zes.com/en/Applications/Field-of-application/Frequency-converter)
The active power component of the higher-frequency components is about 13 % of the total active power.

Highly accurate measurement systems are required for power analysis. The current transducer in particular can lead to undesirable inaccuracies in the measurement. In the international standardization for current and voltage transformers, the IEC 61869 family, defines the accuracy class 0.1 as the maximum. This class corresponds to a ratio error of ±0.1 % in the nominal range of the instrument transformer. For power analysis and efficiency determination, high-precision sensor technology is required that avoids major inaccuracies in the measurement chain. Danisense fluxgate current transducers are the current transducers of choice in the measurement range extension for the power analyzer. The latest model DW500UB-2V offers a highly accurate bandwidth up to 10 MHz if the user is able to compensate the time-delay in the power analyzer. If current sensors with a lower bandwidth are used, filter measures in the PA should limit the analog bandwidth. However, in many cases these measures have a negative influence on the accuracy of the PA because analog components are added to the measuring channel. Especially with newer semiconductor modules based on silicon carbide, switching frequencies in the range of 50-100 kHz can be expected. The integer multiples usually extend into the MHz range. High-precision wide-bandwidth fluxgate current transducers like the DW500UB-2V are recommended.